
Interest Rate Risk in the Banking Book (IRRBB) is pretty much as the name suggests. You have a book of financial instruments that you want to hold until maturity and you want to know how much of that money is at risk if the interest rates move against you. To understand why this is so important we need to understand first what the Banking Book (BB) is; and second what Interest Rate Risk is (IRR).
The Banking Book
The Banking Book is the collection of assets on a bank’s balance sheet that are expected to be held until maturity. These types of assets can be both long and short dated but are generally considered to not be available for sale or trade. In Australia, a large proportion of these financial instruments are customer loans and deposits, both retail customers and corporate customers. In addition to these there are also hedging instruments designed to offset any losses the bank might incur from holding these large assets to maturity. The hedging instruments are usually derivatives, and some of those can be quite complicated!
Another definition of the Banking Book could be the collection of any asset that simply does not meet the requirements for an assignment to the Trading Book (TB).
Interest Rate Risk
An interest rate is a value (usually expressed as a percentage) that defines the price of money. Knowing how much money is worth today versus it’s worth tomorrow provides a sense of it’s worth, in turn, this describes the worth of goods and services in an economic community. An interest rate for cash, for example, is essentially determined by what a large corporation or even a government could do with that cash in a certain amount of time. If a bank could take that cash, invest it somehow, then return the cash (and the profits from that investment less any fees it deems it’s activity is worth), then the profit expressed as a percentage of the original amount is the interest rate of cash – also known as the cash rate.
Other financial instruments have other interest rates depending on their supply, demand and ease of use. For example, a government bond has an associated interest rate, called the risk free interest rate. Why ‘risk-free‘? Because governments are considered as the safest cash-dealing entity in a country. The risk-free interest rate is the rate that reflects what a government could do with your money, earning a profit, and returning that money to you at a later date – this is essentially what a government bond does. Since governments are safe due to all their rules and regulations, there’s not much it can do with your money so the interest rate here is generally the lowest value of all interest rates.
We won’t be reviewing every type of interest rate here, for more examples take a look at the wikipedia site here.
Changing Interest Rates
Interest Rates change, and when they do, the (present) value (PV) of everything that uses that rate changes. This is bad for a bank when the interest rate moves in such a way that lowers the PV of your assets. Thus the fair market value of a Bank’s assets are directly linked to the interest rates. One interesting calculation that can be done easily here is to first calculate the PV of all the assets, shock the interest rate against you, then calculate the PV of all the assets again. The difference in the PV is called delta-EVE and constitutes one of the two main IRRBB measures of risk.
Luckily bank’s rarely leave any asset un-hedged, and so most, if not, all the assets will have an equal and opposite asset whose price will increase when interest rates move against them.
The problem is that it is very difficult to maintain a perfect hedge. This is due to the fact that the hedging instruments are usually derivatives. Why? Because they have to be; anything whose price moves in the opposite direction to what is expected pretty much has to be some kind of derivative. In addition to present value, future cash flow timings will change, particularly with bonds; and here, again, we see that a hedge will fail when timings change. The risk arising from the timing of payments due to changes in interest rates is referred to as gap risk – the amount of gap risk can be dependent on the nature of the interest rate change too.
Changing interest rates can cause another type of risk called basis risk and this arises specifically when you have an asset (priced under one type of interest rate) and the hedging asset (priced under another type of interest rate) becoming mis-matched due to different changes in both interest rates.
The Shape of Interest Rates
Interest Rates also have a shape. How? Because an interest rate is dependent on time-to-maturity (or tenor). In other words, it’s not constant over the time. The cash rate, for example, might be 2.0%p.a. for an overnight loan of that cash, but for 30 years it might be closer to 10.0%p.a. However, we do not call them interest rate curves, instead they’re called yield curves (a subtle difference exists between what an interest rate is and what a yield is – see this Investopedia article here).
Here is an actual yield curve from Bloomberg:
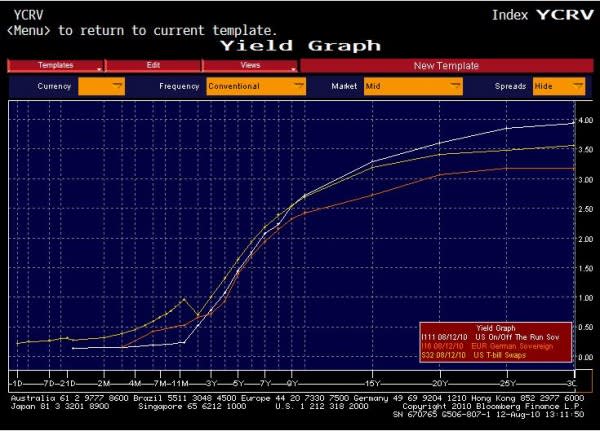
This yield curve (white line) is what is known as an upward-sloping yield curve – it quite clearly slopes upward from the left (the short end – short tenor, like days or weeks) to the right (the long end – long tenors, like tens of years).
Yield curves can also be downward-sloping, or even flat. Other strange shapes like humped. Upward-sloping yield curves are considered normal because we all expect a high rate of return the longer our cash is away being used to invest. However, at times of stress a yield curve can invert and become downward-sloping, meaning that an investor would receive less return than what they might expect from normal yield curve for a longer investment. Another way to say this is that an economy with an inverted yield curve cannot generate large returns in the long-term possibly due to some uncertainty about the health of that economy. And here we see that the yield curve contains vital information about the expectation of the health of a market within an economy: a normal yield curve that suddenly inverts means something has happened that has caused doubt over whether or not that market can generate long-term returns.
Simulating Risk
As discussed, yield curves are generally upward-sloping. Most of the time an asset is bought and then valued by discounting its future expected cash flows back to today along the upward-sloping yield curve. This sort of procedure happens at least once every day for every single asset on the banking book. We can simulate a crisis by discounting along an inverted yield curve and compare the difference in the present value. An inverted yield curve will have smaller interest rates and so the present value of the cash will be smaller and suddenly your assets will have less value.
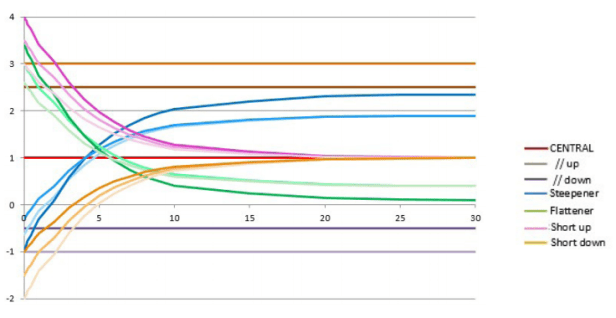
However, the question of: “by how much should we invert the curve?” arises. While there are an infinite number of ways to invert the curve, there is only one way to parallel-shift a curve. So, for many years, bank’s would simply shift the entire yield curve down by several points and use that as the proxy for a crisis. The problem with that is that it is highly unrealistic! The yield curve almost never behaves like that. Instead what happens is that the long-end tends to move downward first, usually reflecting some future issue being accounted for (like an election, or a policy due to be enacted in 10 years, or something). Then that change moves along the curve toward the short-end as time goes by. The short-end typically reacts less to changes in the economy, and acts more like an anchor. Thus, a more realistic simulation of risk would be to steepen (or flatten) the yield curve. And in the case of a short-term shock that does not affect the long-term outlook of rates, a short-up (or short-down) shock is more appropriate. These six shock types are what constitutes the new standardised framework for IRRBB.
Low Interest Rate Environments
It is undeniable that we are currently in a low interest-rate environment – both in Australia and in the U.S. and many other parts of the world. 10-year U.S. Treasury yields have set lower lows consistently since the 1980’s. Today, most government interest rates are either at 0.0% or close to it, some are even negative (for example, Japan’s 10-year Government bond rate has been at -0.1% since 2016, see here).
What this means is that in the wake of the Global Financial Crisis (GFC), world governments have been finding it more and more difficult to do anything with their cash. Further, they are increasingly unable to promise investors any profit on their money, hence a zero percent interest rate on government bonds. This is either to do with their current outstanding debt levels, restrictions on how they use that money, or the demand is simply not there.
There are many reasons why monetary policy may favour low interest rates, but there is one main reason why it is also quite dangerous!
If the 10-year point on a yield curve is at 17.0% and it drops to 16.0%, then this represents a 5.88% change. If that point was instead sitting at 2.0% under a low interest rate environment, and drops the same amount to 1.0% then this now a 50.0% change! Ten times as large a drop. When interest rates get close to zero the percentage change for the same shock increases dramatically.
Looked at the other way. Consider you are used to shocking your interest rates by 5.88% to represent a crisis. Then, under a low interest rate environment, your 5.88% shock would model the 2.0% interest rate dropping to just 1.88%, which is not much of a movement. In other words, stresses to the interest rates under a low interest rate environment must be amended to reflect the situation – we can’t just keep applying the same shocks and get away with it.
Back to IRRBB
In April 2016, the Basel Committee on Banking Supervision issued standards for Interest Rate Risk in the Banking Book that covers Identification of Risk, Monitoring of Risk, and Control & Supervision of Risk. In addition to this, a bank would require more data to be able to identify the risk; build more automated systems in order to monitor these risks; and set new stress scenarios to control the risk. What we’ve discussed so far is referred to as Pillar 1 which is meant to set a standardised Minimum Capital Requirement (MCR) based on two metrics: the Economic Value of Equity (EVE) and the Net Interest Income (NII) as measured under the six interest rate scenarios: parallel shift up & down, steepen, flatten, short-end-up & down:
Summary
In this article we have looked at IRRBB, the Interest Rate Risk in the Banking Book, by defining first what the Banking Book is and then looking at Interest Rate Risk and how it plays a major role in determining the present value of assets. We looked at two measures of how to measure the risk due to interest rate movements: Economic Value of Equity (EVE) and Net Interest Income (NII). To assess possible bad scenarios in order to prepare for it we looked at the need for the six interest rate curve shocks which goes toward calculating the Internal Capital Adequacy Assessment Process (ICAAP). But further work would need to be done to determine more hypothetical and more severe interest rate stress scenarios.

Wonderful article, thank you so much. Finally a clear and understandable description of IRRBB and yield curves. I wish I have found your website when I first started working in finance.
Keep up the great work!
Best
VP