
Welcome to the 4th article in my series on Quantum Computing.
In the last article we had begun creating new Python files in PyCharm on a Linux/Ubuntu virtual machine. While doing so we learned how to install Python packages via the Terminal inside our virtual environment and saw them appear in our list of PyCharm site-packages. I believe this is a good way of managing Python packages because, as we will see, there will be some occasions (particularly with new packages like Qiskit) where we might need to edit a particular library and we do not want this to affect the same library installed elsewhere.
In this article we will continue to use PyCharm and we will be installing Qiskit, again, in to a virtual Python environment. We will also be creating an IBM Q Experience account to get an API to use so that we can send an actual quantum computer some instructions. Lastly, we will encounter some issues with graphing results from Qiskit which will be solved.
Installing Qiskit
Press Alt+Ctrl+T to open Terminal.
Activate the Quantum virtual environment by first changing directories to the Python environments folder $ cd py_envs and then typing in $ source Quantum/bin/activate. Now open up the Quantum project by changing directories with (Quantum) $ cd Quantum. List the Python packages currently installed in this virtual project with the command (Quantum) $ pip3 list. At the very least you should have the following installed:
- numpy
- pip
- pipenv
- requests
- scipy
- setuptools
- virtualenv
If these are not installed, or if you need a refresher on how to use our Quantum virtual environment, go back to the previous articles.
Install Qiskit by typing in
(Quantum) $ pip3 install qiskit
Note that you may get a
Failed building wheel for ...
error message. But this is expected behaviour (see here).
Once it has finished (took about 2 minutes for me) type in (Quantum) $ pip3 list to verify it is in the list of installed packages. You will note that quite a few new packages have been installed, some of which are:
- pandas
- qiskit
- qiskit-aer (Quantum Circuitry)
- qiskit-aqua (Quantum Algorithms)
- qiskit-ibmq-provider (Connecting to Real Quantum Computers)
- qiskit-ignis (Quantum Noise Mitgation Software)
- qiskit-terra (Quantum backend software stacks)
- Quandl
- scikit-learn
Now type (Quantum) $ PyCharm to load GUI.
Verify that the Qiskit packages have been installed by going to the left-hand side Project panel, under External Libraries > Python 3.6 (Quantum) > site-packages.
Creating an IBM Q Account
We now need to create an IBM Q Account so that we can obtain an API Key that lets us connect to the IBM Quantum Computer.
Begin by creating a free IBM Q Experience Account here. Follow the prompts to register (sign-up for) an account with your hotmail (or other) email address. Or go straight to the Sign-Up page here.
If you already have an account sign in now.
Finding your IBM Q API Token
In the top right hand corner, click the User button, then select My Account from the drop-down menu.
On this page, your IBM API token can be copied from this section here:
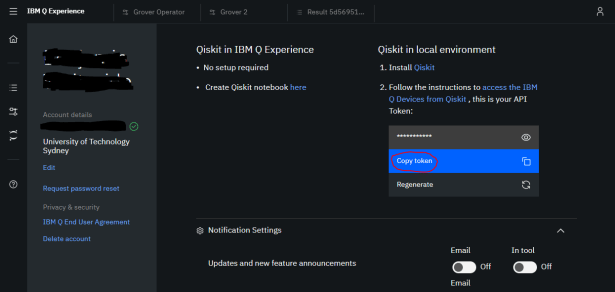
Save your IBM Q API Token somewhere as we will need it later.
Saving your IBM Q Experience API to the PyCharm Project
Create a new Python file to the Quantum project root (right-click Quantum, select New and the Python File). Name this Python file main.py.
Open main.py.
Open the Python console inside PyCharm and type in
>>> qiskit.__qiskit_version__
You should see the following versions returned to the screen
- qiskit-terra v0.9.0
- qiskit-ignis v0.2.0
- qiskit-aqua v0.6.0
- qiskit v0.12.0
- qiskit-aer v0.3.0
- qiskit-ibmq-provider v0.3.2
In the main.py program type the following
from qiskit import IBMQ

IBMQ.save_account('[Insert you API Token Code here]')
Hit Ctrl+S to save. Then Run the program by pressing Shift+F10.
The process should finish with exit code 0.
Now you have saved your API token to the Python program and you shouldn’t have to do this again.
Our First Qiskit Program
Right-click on the Quantum root folder, select New and select Python File. Name it testQiskit.py and finish creating by double-clicking on Python File.
Inside the testQiskit.py file type the following:
import numpy as np
from qiskit import (QuantumCircuit, execute, Aer)
from qiskit.visualization import plot_histogram
Note! Before running be sure to hit Ctrl+Shift+F10 to add the new program to the list of runnable programs otherwise you will just be running the previously ran program. This caught me out a couple of times.
Run this code. It should finish with Process finished with exit code 0.
PyCharm Qiskit Syntax Highlighting Problem
When I first started typing Qiskit code in to PyCharm I noticed that all the code was greyed out! The intellisense worked perfectly and I was easily able to access all the class objects with the dot operator, but the code was just formatted all grey – as if indicating that it could not find the imported class interface!
Turns out, all I had to do was go File > Synchronize, then File > Invalidate Caches / Restart and then select Yes to invalidate all Caches and Restart. Upon restarting all the Qiskit code was correctly highlighted! For more information, see here or here.
Note! When I did this, however, I immediately lost the Qiskit intellisense but then noted down the bottom of PyCharm that 1 process was running… it was re-indexing all my site packages!

This took about 3 minutes to finish. After which I easily got my Qiskit intellisense back!
Checking that PyCharm can Plot using Matplotlib
Before we can properly run a Quantum algorithm in PyCharm we need to check that it can plot the results that IBM Q sends back. Well, it’s not critical, but I certainly like to see the pictures.
Exit PyCharm if it is open, and go to Terminal.
Make sure you are logged in to your virtual environment and project and type
(Quantum) $ pip3 install matplotlib
Open PyCharm again by typing in (Quantum) $ PyCharm . Let it load and scan & index the new files. While it is doing that you can check for yourself under External Libraries > Python 3.6 (Quantum) > site-packages.
The agg non-GUI backend problem
When I tried the following program:
import matplotlib as mpl
import matplotlib.pyplot as plt

plt.plot([1,2,3,4])
plt.show()
I received the following error:
UserWarning: Matplotlib is currently using agg, which is a non-GUI backend, so cannot show the figure.
Here is another example of the importance of using Python virtual environments. To solve this matplotlib problem we need to install another package call tkinter (see here for more information and an explanation). To do this, close PyCharm and go back to the Terminal. Ensure you are in your virtual environment and use (Quantum) $ sudo apt-get to install tkinter like so:
(Quantum) $ sudo apt-get install python3-tk
Load up PyCharm again and wait for it to index.
Setting the GUI Backend to tkinter
We will now add a little bit of extra code at the top of our program to instruct matplotlib to use the newly installed tkinter as our graphical backend.
import matplotlib as mpl
mpl.use('TkAgg')
import matplotlib.pyplot as plt

plt.plot([1,2,3,4])
plt.show()
And now when you run it a graph should show up in a separate window!

Voila! Now we have PyCharm generating Matlab plots!
Displaying Qiskit Histogram Using Matlibplot
This took me a while.
PyCharm was not generating the Qiskit graphs by itself as I feel like the Visualization methods were designed for use in a Jupyter notebook. Further, I had not paid for the Professional Version of PyCharm so I did not have access to the SciView module. But I was adamant that we should be able to plot stuff with matplotlib, after all it is just numbers.
After some Google searching I came across this post here but still could not get it working.
Finally, this solution by ImportanceOfBeingErnest (thank you) proved to work! But we need to build a custom function.
At the beginning of your code, enter this function definition:
def show_figure(fig):
   new_fig = plt.figure()
   new_mngr = new_fig.canvas.manager
   new_mngr.canvas.figure = fig
   fig.set_canvas(new_mngr.canvas)
   plt.show(fig)
Then, to utilise this function write the following at then very end of your quantum algorithm
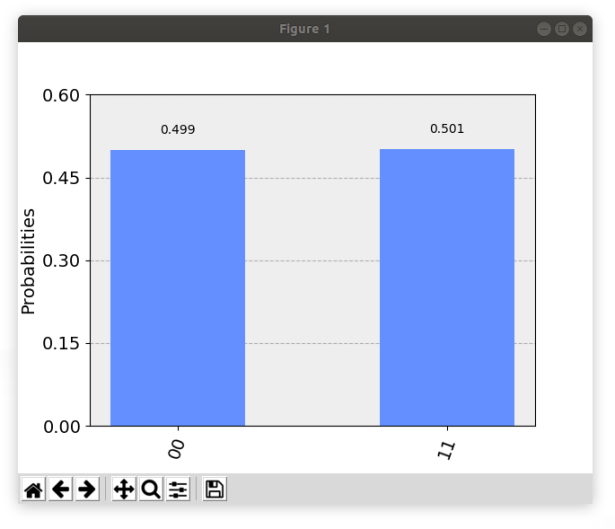
show_figure(plot_histogram(result.get_counts(circuit)))
Running the code now produces a Matlab Plot:
Summary
In this article we
- Installed Qiskit in to a Python virtual environment
- We accessed and imported Qiskit in a Python file in PyCharm
- We managed to get Qiskit graphical output using matplotlib using some workarounds, including
- Installing a graphical user interface backend
- Building a function that forces Qiskit output in to a Matplotlib figure.
In the next article we will continue working in PyCharm and Qiskit and start to build some very basic quantum circuits by combining together some fundamental quantum logic-gates. Lastly, as an interesting challenge we will also attempt to plot a 3D visualisation of a qubit using matplotlib.
